
GFS
USA · NOAA / NCEPGlobal Forecast System: a numerical model that simulates atmospheric physics.
Levi snow forecast. Weather in Levi today and tomorrow. Explore the ski trail map · lift ticket prices · slope difficulty for skiing and snowboarding. Forecast snowfall is new snow expected, not measured snow depth or an official snow report. Check the season and conditions shown with ticket prices.
Ski & snowboard · Trail difficulty · Northern Lights
Fell skiing, snowy forests and a lively village in Finnish Lapland.
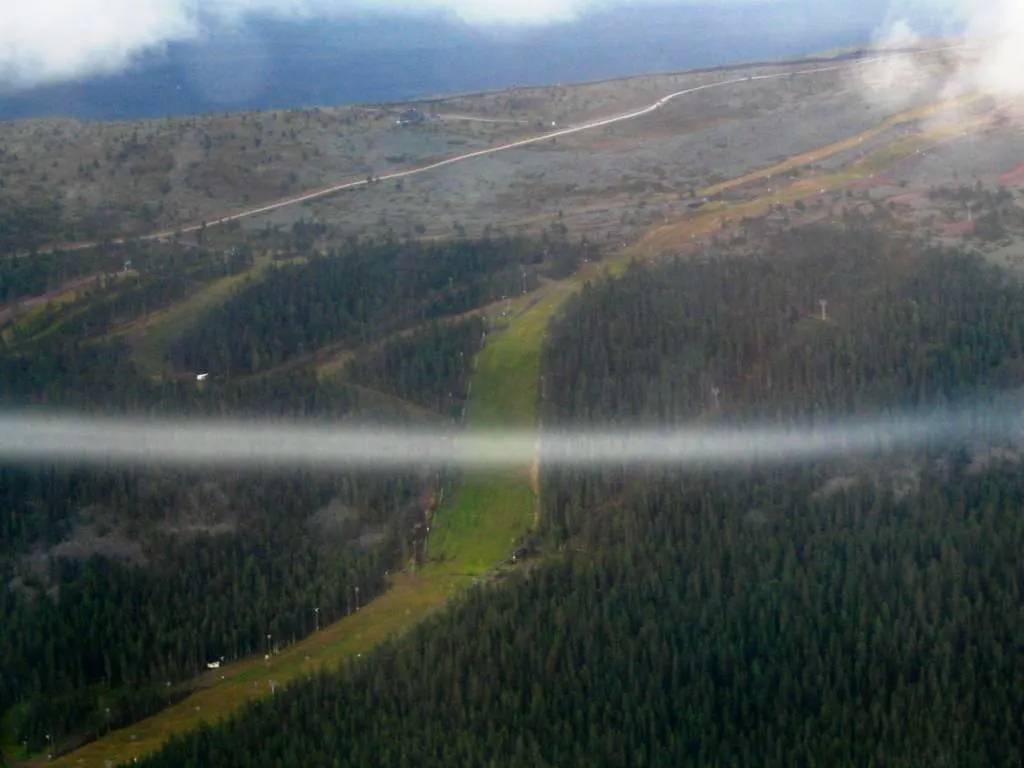
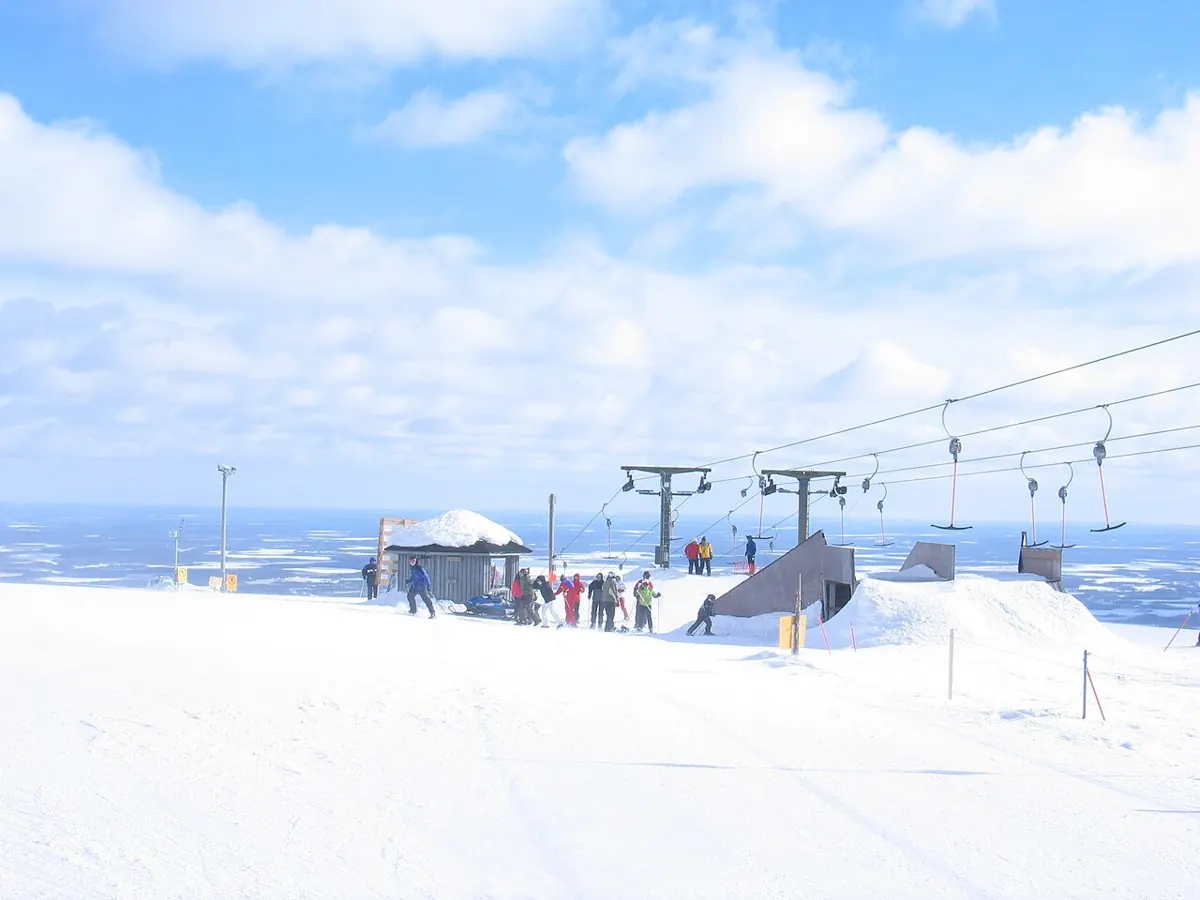
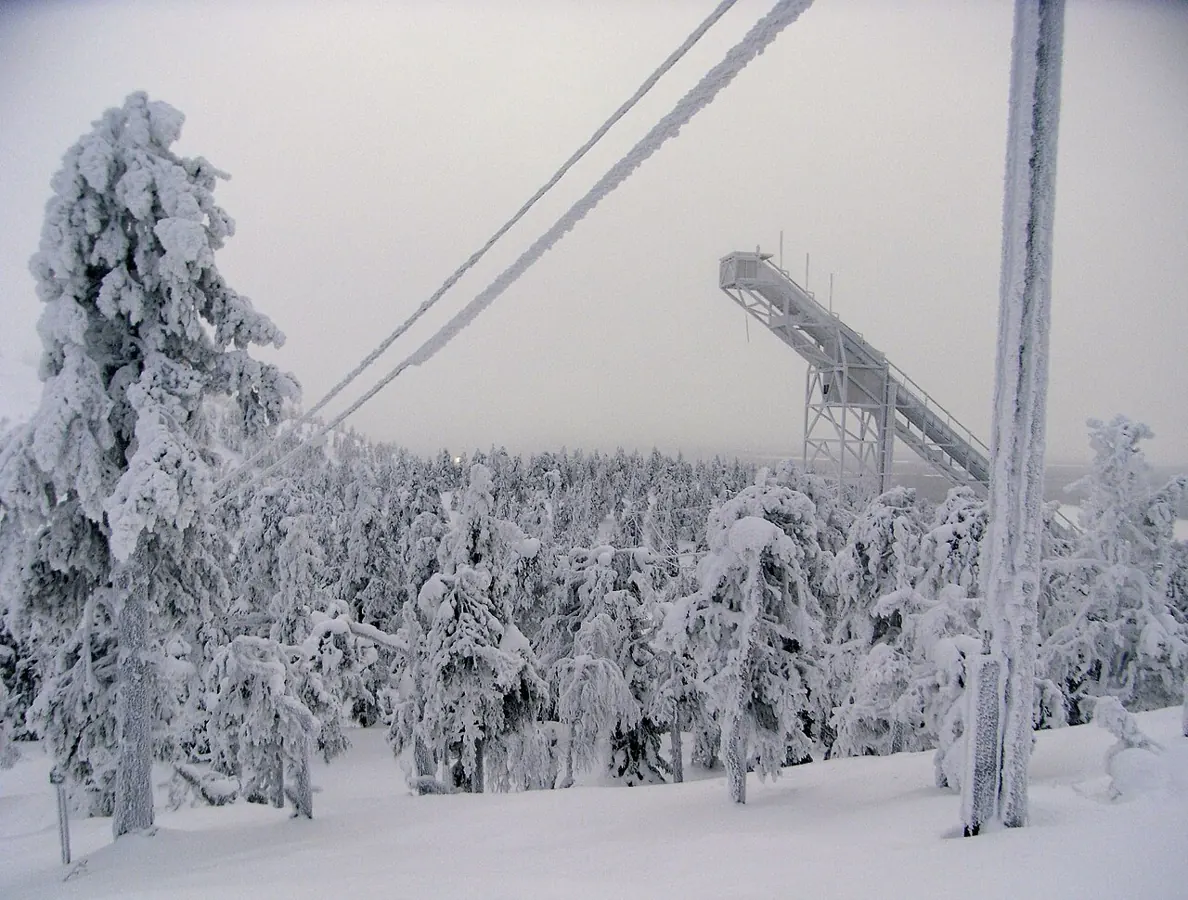
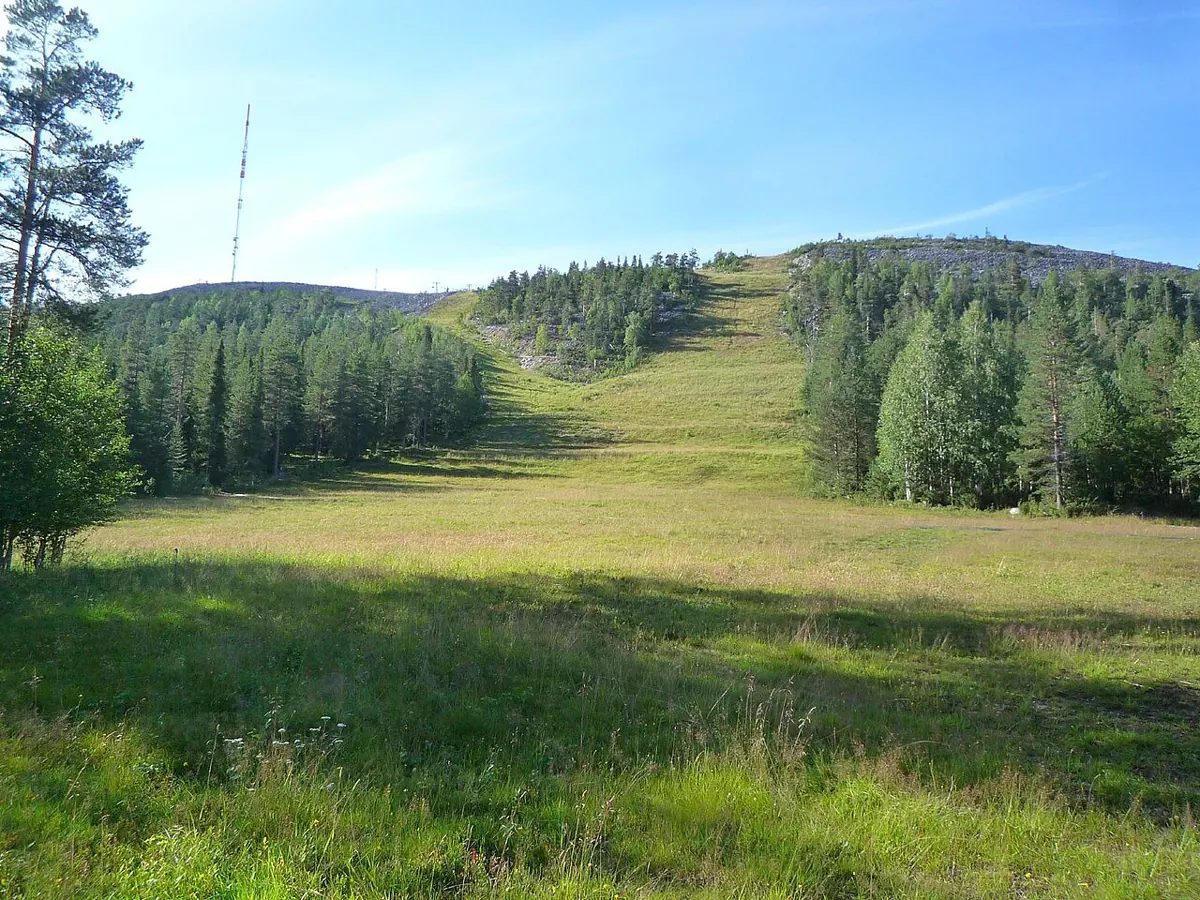
Destination photograph · Levi MattiPaavola · CC BY-SA 3.0 · Image source and modifications
Archive photograph; not current snow conditions.
Choose it for a wider winter holiday rather than very large vertical descents. Daylight varies sharply between midwinter and spring.
February–April is an indicative winter travel window for this destination. It is not an opening calendar or a snow guarantee. Check the resort’s own updates before committing to dates.
Lapland is about the whole winter holiday: fell skiing, snowy forests and long northern evenings. Choose it for atmosphere as much as downhill mileage.
Before setting off, compare the wind and the temperatures at the forecast point with the elevations you plan to ski. New snowfall in the forecast and snow depth on a piste describe different things. The operator’s latest lift and piste report is the place to check what is open.
The forecast point is at about 208 m (Copernicus DEM / Open-Meteo terrain estimate).
For a nearby comparison, Enontekioe is about 81 km away in a straight line. Check both forecasts if your plans include these places. The distance is measured in a straight line, not along the road.
Around the June solstice, there are approximately 24h 00m of daylight, compared with 0h 00m at the December solstice. These are astronomical estimates, not sunshine forecasts; cloud and the local horizon affect the light you see.
Compare seasons in the weather history. Check the selected period, source and data coverage: station observations and gridded historical estimates describe different records.
Distances are approximate and measured in a straight line. Nearby places may not have a direct road, piste or lift connection.
Sources: Destination information · Daylight calculation
A nearby listed settlement is Levi, approximately 1 km from the forecast point in a straight line. GeoNames lists a population of 600 for this settlement.
Population refers to the settlement, not the ski area or its visitors, and may not reflect the latest census. Source: GeoNames · CC BY 4.0
The forecast point is at 67.8060, 24.8050, using the Europe/Helsinki time zone. The nearby ski-area links below let you compare conditions across the region.
Distances are approximate straight-line measurements from the catalogue location. Check the road route and return transport before choosing a place to stay; proximity alone does not establish a convenient transfer.
Open the location map here, plan your route and view available webcams in the area.
Coordinates: 67.806,24.805
The location is a guide reference point, not a verified car park or lift entrance. Check the final approach road with the official source.
Additional camera views are available at the source. Check the provider’s timestamp and operating status.
Separate piste-top, base and village elevations have not yet been documented.
The nearest settlement is not automatically treated as the ski village or base.
Vertical difference is a height difference, not piste length or confirmation that a route is open.
Official source · Source reviewed 2026-10-08
Child 6–11; adult 12–64. Ticket-office rates; add EUR 8 keycard. Online discount 2%, or 5% when bought ≥14 days ahead for 1 Dec 2026–2 May 2027.
Size and access
For Levi a comparable total piste length has not been verified from the sources checked. A missing value does not mean there are no pistes. Destination information.
Local, linked and regional totals overlap and must not be added. Run counts and terrain in acres are different measures from piste length in km.
Levi has a dedicated learning area and Leevilandia Family Park. South Park, Junior South Park and Fun Park are also named. The operator describes blue beginner, red intermediate and black advanced slopes, without verified counts by category.
Park operation and layouts depend on the season and conditions.
A complete numerical trail breakdown has not been verified. Missing counts do not mean those categories are absent.
Official information: Source 1 · Reviewed 11/10/2026
Approximate levels only: easier European green/blue ↔ US green circle; European red ↔ US blue square; European black ↔ US black or double black diamond.
This is not a one-to-one match or a guarantee of difficulty. European blue does not automatically mean US blue. Ratings are relative within each resort; follow its official map and account for snow conditions.
Sources: NSAA · Ski amadé · Portes du Soleil
Mapped ski pistes and lifts around Levi. Explore the mapped routes and compare them with the operator’s official map.
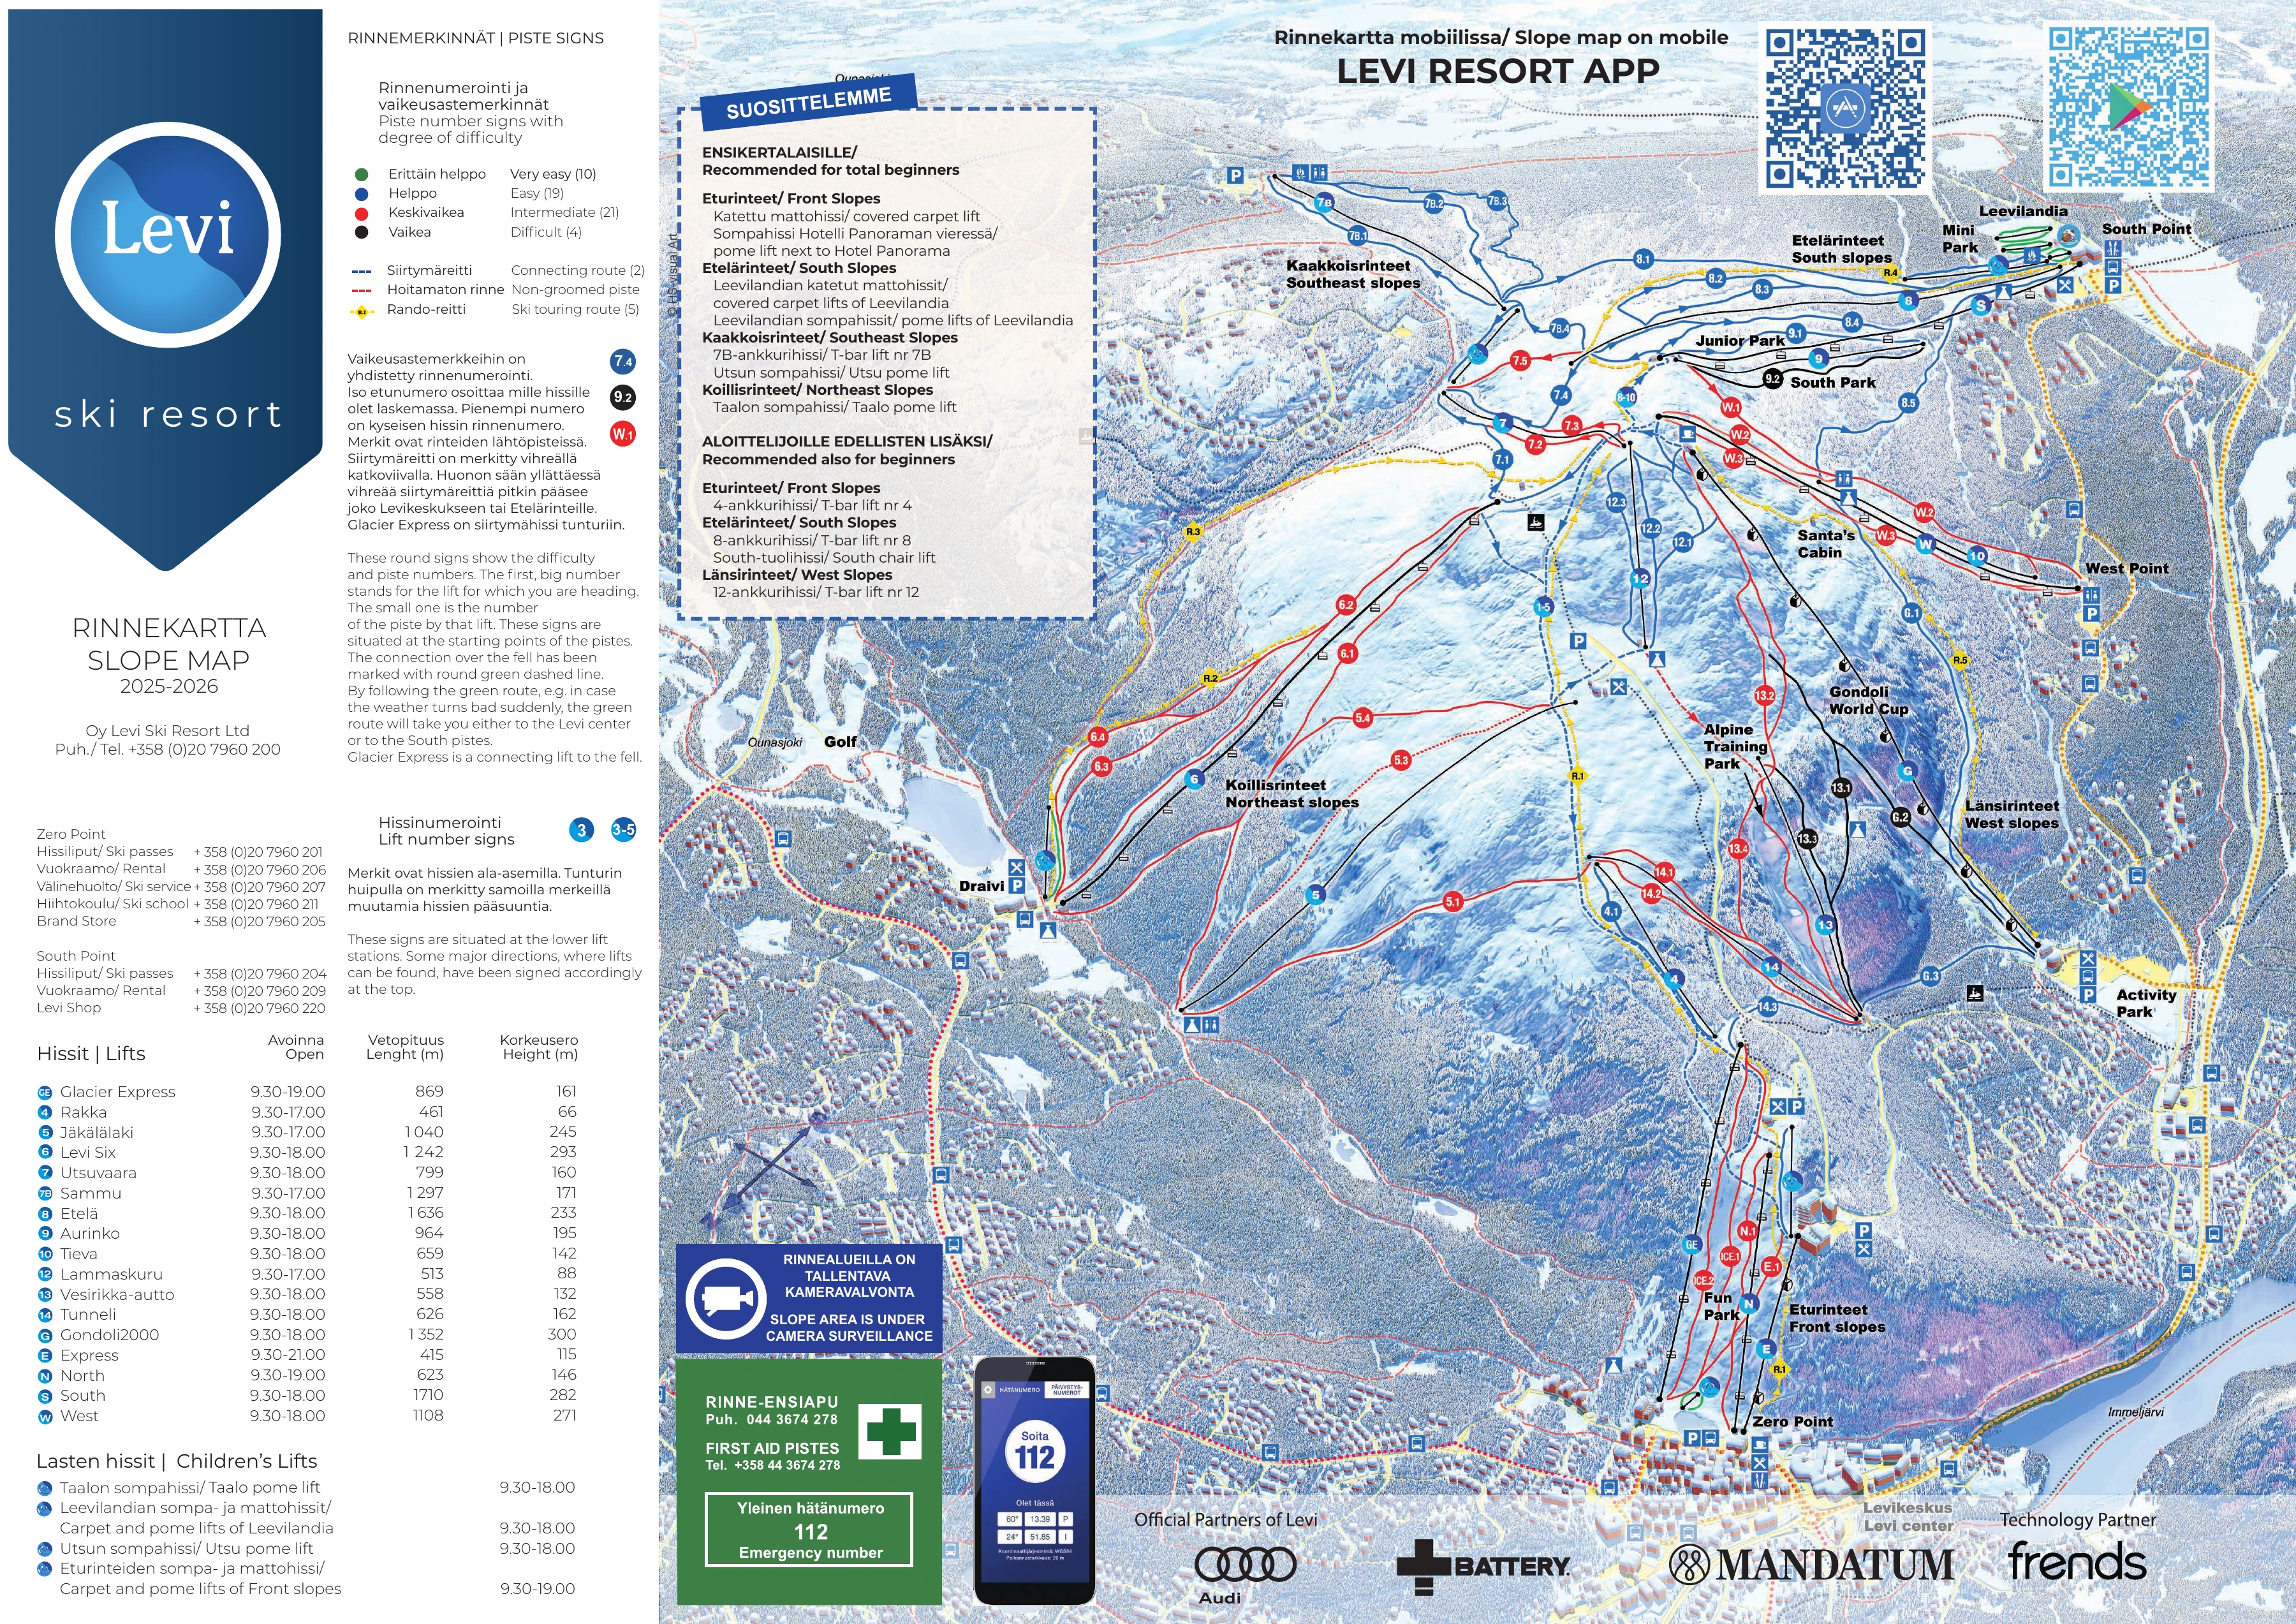
Enlarge map · 3600 pxOriginal imageOfficial map source
© OpenStreetMap contributors · OpenSnowMap.org · Rendering: XIONIA
Interactive map: OpenSnowMap. Images above: official resort piste maps.
Aurora outlook for Levi: the global NOAA Kp forecast is considered alongside local darkness and available cloud forecasts. Data coverage may be partial; no sighting is guaranteed.
The three local dates and available data load when this section comes into view.
GFS · ECMWF IFS · AIGFS · AIFS · GEM. Forecast at an indicative destination point; not a summit forecast or live snow depth.
Loading local weather signals…
See also location and elevation selection · Levi, the forecast table · Levi, the charts · Levi, the model comparison · Levi and weather history · Levi.
Start with the 14-day weather forecast. Open the detailed tables to compare models, then explore hourly temperature, precipitation, wind and 850 hPa in the meteogram. Ensembles show the spread of possible outcomes; satellite images show observed clouds.
Available model families combine per variable. “Today” with hours in parentheses covers the stated window; subsequent days require full local coverage. Days 8–14 are less certain; missing data remain blank. Snowfall cm are fresh snow, not snow depth. Sea-level pressure. Terrain temperature downscaling by Open-Meteo; no Agios Stefanos calibration. A point forecast cannot describe every piste or assess avalanche danger. Open-Meteo
Forecasts at the resort and surrounding locations. Zoom or move the map and select a weather label.
Select a point for its forecast. Peaks and road passes are separate categories; a map position does not indicate a ski route or an open road.
The map loads as it approaches the screen.
850 hPa temperature, 2 m temperature and precipitation ensembles for Weather in Levi. Choose Open-Meteo or Direct. Auto tries Open-Meteo first, then Direct when unavailable. Direct retains the native time steps of each model; the displayed source and interval apply. Individual member availability varies by model and variable.
Weather models and interactive ensembles · Model comparison · Weather in Levi
Visible, infrared and available RGB cloud imagery for Weather in Levi. Satellite coverage and observation times vary by region.
Satellite images and rain radarThis summary uses the destination’s fixed coordinates and the historical service’s terrain elevation. It does not change with the forecast’s manual elevation setting. Mountain terrain, wind redistribution and snowmaking are not fully represented. Snowfall days do not indicate opening days or piste snow depth.
Explore rain and snowfall frequency, monthly average daily lows and highs, and daily temperature extremes over the selected period.
The historical summary loads automatically…
| Month | Mean low °C | Mean high °C | Precipitation mm/month | Rain days/month | Snowfall days/month |
|---|
Choose 10, 20 or 30 years of temperature and precipitation history. The 100-year option searches for a nearby NOAA station with a sufficiently long record; the table shows the actual coverage. NASA POWER / MERRA-2 and ERA5 provide gridded historical estimates, while NOAA GHCNd contains station observations. These sources are shown separately, not combined into one time series.
A precipitation day has at least 1 mm of total precipitation. Where a source reports rain separately, the rain-day figure covers rain alone. A snowfall day has at least 0.1 cm of fresh snow where that variable is available; it does not establish snow cover on the ground. NASA POWER does not provide snowfall here. Blank values mean missing data, not zero. Averages and extremes use only the complete months or years stated in the table. These historical figures do not automatically calibrate the forecast.
Verified ski connections come first. Other destinations are ordered by straight-line distance, which does not imply a piste or road connection.
Global Forecast System: a numerical model that simulates atmospheric physics.
Artificial Intelligence Global Forecast System: a machine-learning model initialized from NOAA atmospheric analyses.
Integrated Forecasting System: the intergovernmental European centre’s numerical model. IFS 9 km and IFS 0.25° are products of the same model family on different data grids.
Artificial Intelligence Forecasting System: this page uses AIFS Single, which produces one forecast scenario.
Global Environmental Multiscale: the atmospheric model within Canada’s GDPS. The current system combines numerical prediction with large-scale guidance from the GEML AI model.
Regional numerical weather model for Europe, with a finer grid than the global ICON version.
Global numerical weather model from the German Weather Service. Resolution varies by data product.
Global numerical forecast from the Met Office. MOGREPS-G is the provider’s separate ensemble system.
European output from Météo-France’s ARPEGE numerical model. Coverage and variables depend on the available product.
Global Spectral Model: the Japan Meteorological Agency’s global numerical weather model.
Artificial intelligence ensemble with 31 members. It complements the single AIGFS forecast with alternative scenarios and their spread.
The blend uses the values available for each day and variable. Coverage falls as individual models reach their forecast limits. The two IFS products are not independent models. Model spread shows disagreement, not the probability of a weather event.
Wind: maximum daily speed at 10 m and prevailing direction of origin. Direction uses a speed-weighted circular calculation; missing or strongly opposing directions display a dash. 🥶: low below 0°C. 🥵: high above 30°C. 💨 in Conditions: wind at least 40 km/h or gusts at least 60 km/h.
Forecast data: Open-Meteo · NOAA / ECMWF / ECCC.
The choice applies to widgets, maps and forecasts. Actual station readings stay unchanged. Automatic tries Open-Meteo first, then available direct sources if a supported request fails.
Data service providing forecasts from NOAA, ECMWF, ECCC, DWD, the Met Office, Météo-France and JMA. Available models, variables and grids depend on the location and product.
XIONIA collects data directly from the model providers. Forecasts and maps are served after the source cycle has been published and collected. The selected product shows its model, resolution, available variables and run.
Each available family contributes once per variable. Direct forecasts select the freshest available GFS grid and use equal family weights as the baseline. Local weights apply only where enabled after validation. The comparison shows actual percentages and model cycles.
Additional model forecasts are also shown for comparison and backtesting. Their presence does not automatically add weight to the combined forecast; check the displayed weights.
A dash means unavailable data. Wind and gust may use different models. AIGFS temperature is excluded when it cannot be compared on the same elevation basis. Six-hour precipitation is water equivalent, not snow depth.
A “Today” label with hours in parentheses covers only the stated time window; subsequent days require full local coverage. Days 8–14 are a less certain outlook. Agreement between models is not a probability from a true ensemble.
Ensemble systems provide multiple forecast scenarios; the available systems appear in the chart selector and image catalogue. AIGFS is the single forecast; AIGEFS is the separate ensemble. Available variables and forecast horizons differ by system.
Open-Meteo · NOAA · ECMWF Open Data · ECCC Open Data · DWD / ICON · Met Office / UKMO · Météo-France / ARPEGE · JMA
Pass Atlas · Mountain road passes
The forecast point for Levi is at 208 m (Lapland · 67.8060°, 24.8050°).
Use the daily forecast to compare fresh snow, temperature and wind. The mountain view shows the selected day and model; XIONIA’s combined forecast is selected initially. Fresh snowfall and snow already on the ground are separate measurements. Snowfall elevation is a model value or a labelled approximate estimate when available. Days 8–14 show a less certain trend.
The forecast refers to this point; conditions on the summit and at the ski base can differ. Check the resort operator for lift and piste status.
A day of skiing or snowboarding in Levi, in Finnish Lapland, can end with a look at the night sky. Use the hourly forecast to plan clothing and timing for an evening outside: check temperature, wind and any rain or snow through your return. Conditions on higher slopes can differ from those shown in the local forecast.
When planning to look for Northern Lights, compare the evening cloud forecast and the hours of darkness with the Aurora guide. NOAA activity estimates help you follow the situation, but a promising signal is not a guarantee of a visible display. Check the resort’s access information before using ski terrain after dark.
Aurora map, Kp and viewing conditions
Visit Levi describes an August–April viewing season. For a winter or early-spring ski and snowboard trip, plan a separate dark-sky outing after the slopes. April nights grow brighter, so check darkness for your exact dates.