
GFS
USA · NOAA / NCEPGlobal Forecast System: a numerical model that simulates atmospheric physics.
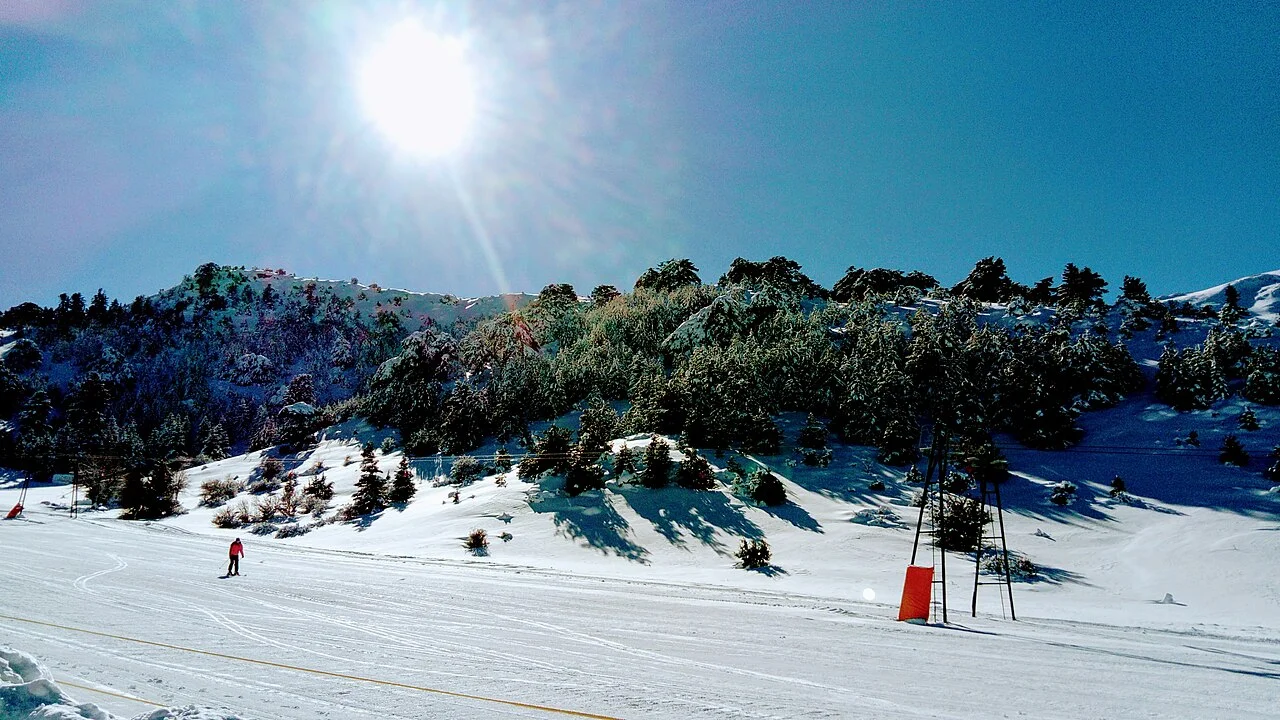
Snow-covered slope and facilities at Ziria. Archive photograph; it does not show current snow or opening conditions.
GFS · ECMWF IFS · AIGFS · AIFS · GEM. Forecast at an indicative destination point; not a summit forecast or live snow depth.
Loading local weather signals…
See also location and elevation selection · Ziria, the forecast table · Ziria, the charts · Ziria, the model comparison · Ziria and weather history · Ziria.
Start with the 14-day weather forecast. Open the detailed tables to compare models, then explore hourly temperature, precipitation, wind and 850 hPa in the meteogram. Ensembles show the spread of possible outcomes; satellite images show observed clouds.
Available model families combine per variable. “Today” with hours in parentheses covers the stated window; subsequent days require full local coverage. Days 8–14 are less certain; missing data remain blank. Snowfall cm are fresh snow, not snow depth. Sea-level pressure. Terrain temperature downscaling by Open-Meteo; no Agios Stefanos calibration. A point forecast cannot describe every piste or assess avalanche danger. Open-Meteo
850 hPa temperature, 2 m temperature and precipitation ensembles for Weather in Ziria. GEFS, AIGEFS, ECMWF IFS ENS, AIFS ENS, GEM GEPS. Direct data from NOAA, ECMWF and ECCC, at common six-hour steps. Individual member availability varies by model and variable.
Weather models and interactive ensembles · Model comparison · Weather in Ziria
Visible, infrared and available RGB cloud imagery for Weather in Ziria. Satellite coverage and observation times vary by region.
Satellite images and rain radarThis summary uses the destination’s fixed coordinates and the historical service’s terrain elevation. It does not change with the forecast’s manual elevation setting. Mountain terrain, wind redistribution and snowmaking are not fully represented. Snowfall days do not indicate opening days or piste snow depth.
Explore rain and snowfall frequency, monthly average daily lows and highs, and daily temperature extremes over the selected period.
The historical summary loads automatically…
| Month | Mean low °C | Mean high °C | Precipitation mm/month | Rain days/month | Snowfall days/month |
|---|
Choose 10, 20 or 30 years of temperature and precipitation history. The 100-year option searches for a nearby NOAA station with a sufficiently long record; the table shows the actual coverage. NASA POWER / MERRA-2 and ERA5 provide gridded historical estimates, while NOAA GHCNd contains station observations. These sources are shown separately, not combined into one time series.
A precipitation day has at least 1 mm of total precipitation. Where a source reports rain separately, the rain-day figure covers rain alone. A snowfall day has at least 0.1 cm of fresh snow where that variable is available; it does not establish snow cover on the ground. NASA POWER does not provide snowfall here. Blank values mean missing data, not zero. Averages and extremes use only the complete months or years stated in the table. These historical figures do not automatically calibrate the forecast.
Make the village part of the trip too. Compare these local guides for accommodation planning, settlement population and time away from the slopes:
Distances are approximate straight-line measurements from the catalogue location. Check the road route and return transport before choosing a place to stay; proximity alone does not establish a convenient transfer.
Ziria ski centre is on the Kyllini plateau above Trikala Korinthias. The centre’s location is distinct from the mountain summit and the villages at lower elevations.
For a family outing or a first experience of skiing, confirm which services and activities are available on your chosen day. Also check the road from Trikala up to the plateau.
Confirm opening, lifts and access with the operator before travelling. Forecast snowfall is not measured piste depth and does not establish that the ski area is open.
The map marks an indicative ski-area location. It is not a surveyed lift station or summit. Check the forecast elevation before comparing it with the slopes you intend to use.
Use the hourly forecast for your planned visit, and the weather history for a longer view of the selected period and source.
Distances are approximate straight-line measurements, not driving distances or piste connections.
Sources: Location information 1 · Location information 2
Global Forecast System: a numerical model that simulates atmospheric physics.
Artificial Intelligence Global Forecast System: a machine-learning model initialized from NOAA atmospheric analyses.
Integrated Forecasting System: the intergovernmental European centre’s numerical model. IFS 9 km and IFS 0.25° are products of the same model family on different data grids.
Artificial Intelligence Forecasting System: this page uses AIFS Single, which produces one forecast scenario.
Global Environmental Multiscale: the atmospheric model within Canada’s GDPS. The current system combines numerical prediction with large-scale guidance from the GEML AI model.
The blend uses the values available for each day and variable. Coverage falls as individual models reach their forecast limits. The two IFS products are not independent models. Model spread shows disagreement, not the probability of a weather event.
Wind: maximum daily speed at 10 m and prevailing direction of origin. Direction uses a speed-weighted circular calculation; missing or strongly opposing directions display a dash. 🥶: low below 0°C. 🥵: high above 30°C. 💨 in Conditions: wind at least 40 km/h or gusts at least 60 km/h.
Forecast data: Open-Meteo · NOAA / ECMWF / ECCC.
The choice applies to widgets, maps and forecasts. Actual station readings stay unchanged. Automatic tries Open-Meteo first, then available direct sources if a supported request fails.
A data service supplying NOAA, ECMWF and ECCC forecasts. Available model names and grids are shown with each forecast.
Direct GFS, AIGFS, IFS, AIFS and GEM/GDPS data from the Xionia cache when a complete recent cycle is available. Supported grids are GFS 0.25° / 0.5°, AIGFS 0.25°, IFS 0.25°, AIFS 0.25° and GEM 0.15°.
Each available family contributes once per variable. Direct forecasts select the freshest available GFS grid and use equal family weights as the baseline. Local weights apply only where enabled after validation. The comparison shows actual percentages and model cycles.
A dash means unavailable data. Wind and gust may use different models. AIGFS temperature is excluded when it cannot be compared on the same elevation basis. Six-hour precipitation is water equivalent, not snow depth.
A “Today” label with hours in parentheses covers only the stated time window; subsequent days require full local coverage. Days 8–14 are a less certain outlook. Agreement between models is not a probability from a true ensemble.