Weather in Metsovo today and tomorrow: check the 14-day weather forecast and the hourly weather meteogram for temperature, precipitation and wind. The later forecast days show a more uncertain outlook.
Weather maps, ensemble charts and local forecasts
Compare the local forecast and ensemble spread with weather forecast maps for Greece, European weather maps and world weather maps. Explore temperature, precipitation, wind and pressure, depending on the variables available for the selected model. Check the valid time and run shown on each map before comparing charts.
GFS, IFS, AIGFS, AIFS, GEM · available grids are shown with the selected source
The forecast for Metsovo is calculated at the map location shown below. Settlement elevation
is approximate; the live forecast uses the terrain elevation at the selected coordinates.
Choose another point for your own neighbourhood.
Third-party views can be delayed, clouded over or interrupted. Check the provider’s timestamp. An image does not confirm open pistes or safe access.
Click a place marker or temperature label to open its dedicated page. Click an empty map location to view the forecast for those coordinates.
Move the map with the arrow keys and use “Forecast at map centre”.
Loading temperatures…
Forecast low / high and indicative weather for the full local day. More labels appear as you
zoom in. City names and weather cards link to their forecast pages.
Detailed forecast
Start with the 14-day weather forecast. Open the detailed tables to compare models, then explore hourly temperature, precipitation, wind and 850 hPa in the meteogram. Ensembles show the spread of possible outcomes; satellite images show observed clouds.
14-day temperatures
High
Low
Full days in the selected location’s time zone · swipe horizontally on mobile
Day
Outlook
High
Low
850 hPa temp.
Precipitation
Snowfall
Wind
Pressure
Models temp. / precip.
Model comparison
Model
High
Low
850 hPa temp.
Precipitation
Snowfall
Pressure
Weather ensembles · Metsovo
850 hPa temperature, 2 m temperature and precipitation ensembles for Metsovo. Choose Open-Meteo or Direct. Auto tries Open-Meteo first, then Direct when unavailable. Direct retains the native time steps of each model; the displayed source and interval apply. Individual member availability varies by model and variable.
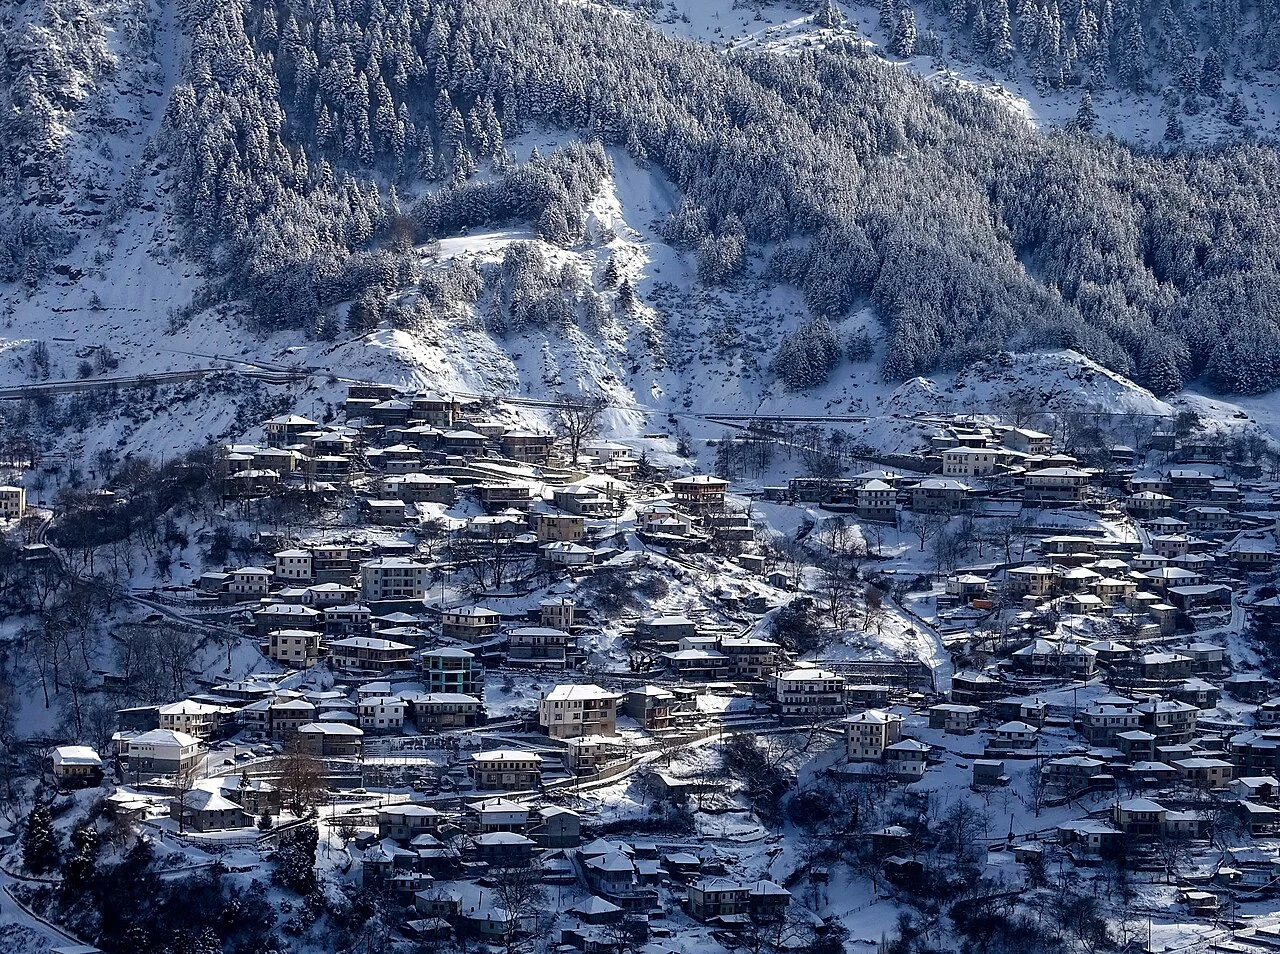
Metsovo gives a Pindus mountain trip a life beyond the slopes: time in the village, a stop in the square and a base for exploring the surrounding mountains. Mixed groups can split the day between skiing and the village, then meet again after the drive back.
Population and place identity
2,337 permanent residents in the 2021 census.
This is the settlement population, not the municipality total. ELSTAT settlement code: 1807010101.
See the forecast for Metsovo. Compare the hours you will actually be outdoors, especially for rain, wind and the return journey.
The existing forecast point has an estimated terrain elevation of about 1,161 m (Copernicus DEM / Open-Meteo).
Combine the village with skiing
Compare the following ski-area guides when planning a separate mountain outing. Confirm opening and the road route from your actual accommodation; the links do not imply lift or piste connections.
Explore rain and snowfall frequency, monthly average daily lows and highs, and daily
temperature extremes over the selected period.
The historical summary loads automatically…
Monthly weather history · selectable period and source
Month
Mean low °C
Mean high °C
Precipitation mm/month
Rain days/month
Snowfall days/month
Temperature and precipitation history over 10, 20 or 30 years. The 100-year option searches for a nearby NOAA station with an archive starting sufficiently early; the table reports actual completeness. NASA POWER / MERRA-2 and ERA5 are gridded historical estimates, while NOAA GHCNd contains station observations. These different sources are not merged into one time series.
A wet day has at least 1 mm total precipitation. Where the source separates rain, the rain-day indicator uses rain only. A snowfall day has at least 0.1 cm fresh snow where supplied; this does not imply settled snow cover. This NASA POWER dataset does not supply snowfall. Missing values are not zero. Averages and extremes use complete months or years as labelled, without automatically calibrating the forecast.
The blend uses available model families once per variable. Grids depend on the selected source and are shown in the comparison. A “Today” label with hours in parentheses covers the stated time window; subsequent days require full local coverage. Missing values remain blank. Days 8–14 are a less certain outlook.
Open-Meteo
automatically uses terrain elevation and temperature downscaling. We do not subtract
another temperature correction per 100 metres or transfer the Agios Stefanos station’s
empirical calibration to other locations. Clicking the map requests the nearest cell of
each model at your coordinates. Listed cities use a land cell with similar elevation.
Zooming does not increase the weather model’s resolution.
Pressure is the daily mean reduced to sea level. Wind is the average of the models’ daily
maximum wind speeds, not a gust. Today includes hours that have already passed; these are
model estimates rather than station observations.
Check the Snowfall column for estimated fresh snow in centimetres and compare individual
models. These values do not predict the final snow depth on the ground. Surface
temperature, wet-bulb temperature, the vertical temperature profile, elevation and
precipitation intensity all matter. A daily minimum or an 850 hPa temperature alone cannot
determine whether snow will fall or settle.
Drizzle, rain, thunderstorms, mixed rain/snow and snow use available model weather codes
and hourly precipitation. Hail is shown only when a model supplies WMO code 96 or 99;
absence of this code does not rule out hail. Open-Meteo currently provides
thunderstorm-with-hail forecasts only in Central Europe, so this signal is not available
for Greece. A daily symbol summarises weather during the day, not every hour. Simultaneous
liquid precipitation and snow within one model hour is labelled mixed; different hours or
models may indicate a transition instead.
💨 Wind ≥40 km/h or gusts ≥60 km/h · 🥶 Low ≤−5 °C · 🌡️ High ≥35 °C. These are display
thresholds, not official weather warnings. Missing gust forecasts are excluded. Symbols
use the same temperatures as the displayed forecast.
Integrated Forecasting System: the intergovernmental European centre’s numerical model. IFS 9 km and IFS 0.25° are products of the same model family on different data grids.
Global Environmental Multiscale: the atmospheric model within Canada’s GDPS. The current system combines numerical prediction with large-scale guidance from the GEML AI model.
Artificial intelligence ensemble with 31 members. It complements the single AIGFS forecast with alternative scenarios and their spread.
The blend uses the values available for each day and variable. Coverage falls as individual models reach their forecast limits. The two IFS products are not independent models. Model spread shows disagreement, not the probability of a weather event.
Wind: maximum daily speed at 10 m and prevailing direction of origin. Direction uses a speed-weighted circular calculation; missing or strongly opposing directions display a dash. 🥶: low below 0°C. 🥵: high above 30°C. 💨 in Conditions: wind at least 40 km/h or gusts at least 60 km/h.
The choice applies to widgets, maps and forecasts. Actual station readings stay unchanged. Automatic tries Open-Meteo first, then available direct sources if a supported request fails.
Open-Meteo
Data service providing forecasts from NOAA, ECMWF, ECCC, DWD, the Met Office, Météo-France and JMA. Available models, variables and grids depend on the location and product.
Direct model sources
XIONIA collects data directly from the model providers. Forecasts and maps are served after the source cycle has been published and collected. The selected product shows its model, resolution, available variables and run.
How models combine
Each available family contributes once per variable. Direct forecasts select the freshest available GFS grid and use equal family weights as the baseline. Local weights apply only where enabled after validation. The comparison shows actual percentages and model cycles.
Additional model forecasts are also shown for comparison and backtesting. Their presence does not automatically add weight to the combined forecast; check the displayed weights.
Coverage and missing values
A dash means unavailable data. Wind and gust may use different models. AIGFS temperature is excluded when it cannot be compared on the same elevation basis. Six-hour precipitation is water equivalent, not snow depth.
Time window
A “Today” label with hours in parentheses covers only the stated time window; subsequent days require full local coverage. Days 8–14 are a less certain outlook. Agreement between models is not a probability from a true ensemble.
Ensemble forecasts
Ensemble systems provide multiple forecast scenarios; the available systems appear in the chart selector and image catalogue. AIGFS is the single forecast; AIGEFS is the separate ensemble. Available variables and forecast horizons differ by system.