AURORA BOREALIS · NORTHERN LIGHTS

Northern Lights & Aurora Borealis — Live Map & Forecast

Where might the northern lights appear tonight? Explore the short-term aurora borealis forecast, the Kp outlook and local conditions to plan your next night under the sky.

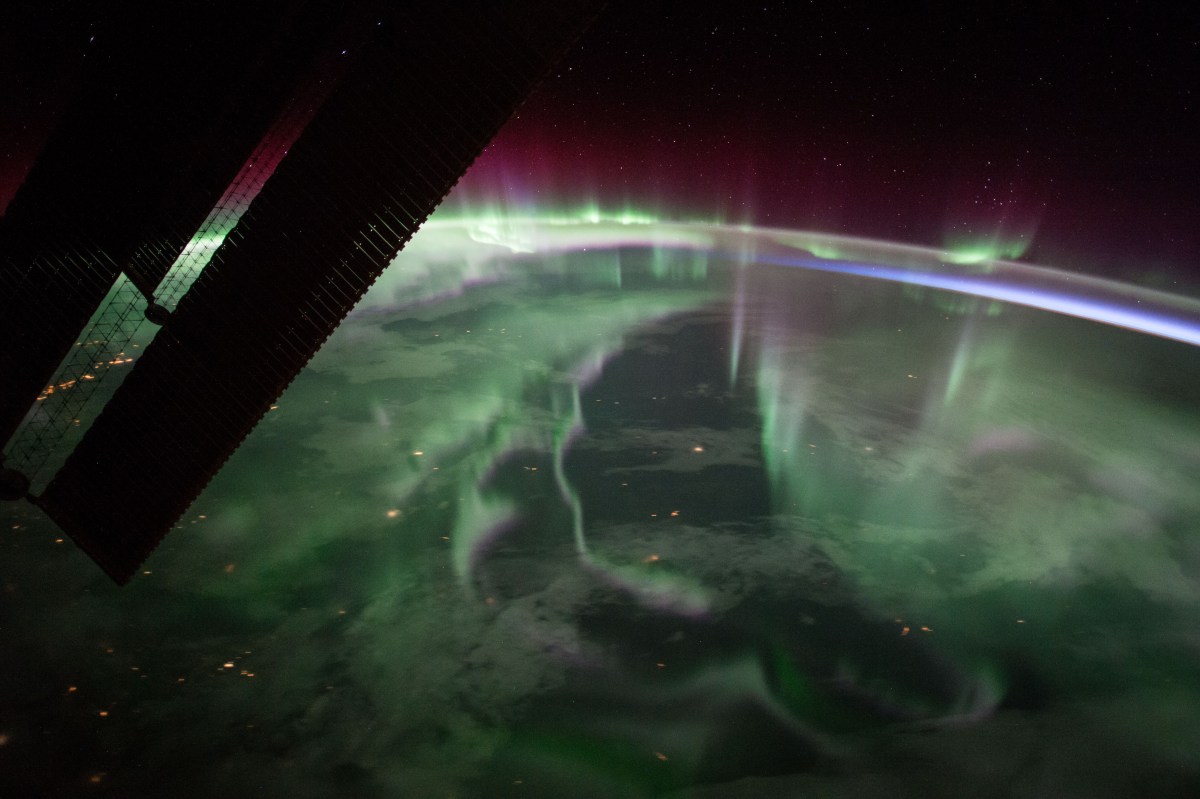
Archive photo: NASA · ISS / 2017
—Latest observed Kp
Checking source…
—Maximum forecast Kp · next 24 hours
—OVATION map valid time
See source status and valid time below.
Loading NOAA data…

Northern Lights now — live Aurora Borealis map

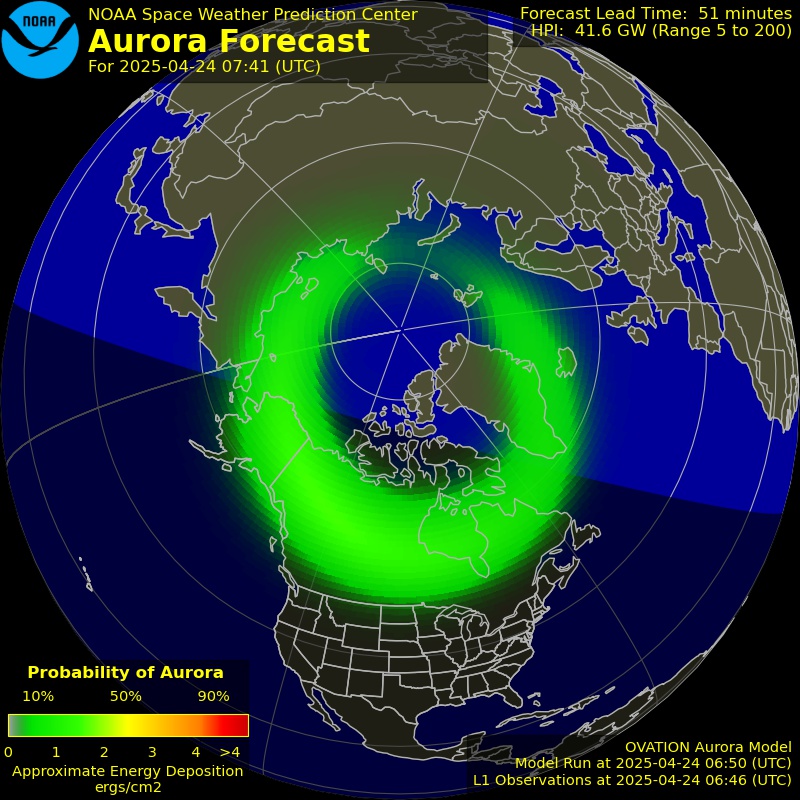
The coloured band shows where NOAA OVATION models auroral activity around the North Pole. This polar view refreshes with the interactive map: green indicates a lower model signal, progressing through cyan and violet to magenta for stronger signals.

This is a short-term northern lights forecast, usually 30–90 minutes ahead, rather than a camera or confirmed sightings. Always check the valid time below the map. Rings mark geographic latitudes, with the geographic North Pole at the centre.

For your location, choose a destination on the map below and compare activity with darkness and cloud cover.

Explore your location on the map ↓

NOAA SWPC · OVATION

Northern lights map now

NOAA OVATION · usually a 30–90 minute forecast

This is a model forecast, not a map of confirmed sightings. Cloud, light and your horizon affect what you can see.

Choose a destination or any point between 30° and 85° N.

Loading official data…

⌁ Aurora destinationsModel signal1100· Zero cell: no colour overlayEnhanced display contrast. Colours show model intensity, not observed aurora colours.

Updates every 5 minutes while the page is visible. Northern hemisphere, geographic map displayed to 85° N. NOAA OVATION · Official polar map

Tromsø

—OVATION
—Sky illumination now · calculated

Detailed weather forecast →

Cloud and weather for aurora watching

Darkness is calculated from solar altitude; it excludes light pollution, moonlight and terrain obstructions. These factors are not combined into an unvalidated sighting percentage.

Aurora outlook · 3-day Kp forecast

Planetary geomagnetic activity in three-hour intervals. Table times are UTC.

Loading…

UTCKpTypeNOAA G

NOAA · 3-day forecast · Kp is not a local sighting probability.

Where to see the northern lights

Norway, Iceland, Swedish and Finnish Lapland, Alaska, Canada and Greenland: choose a place to compare auroral activity with the weather. Cities are reference points; choose a safe dark viewing spot away from bright lights.

AURORA AUSTRALIS · SOUTHERN LIGHTS

Southern Lights & Aurora Australis — Live Map & Forecast

The southern auroral oval, with NOAA data and weather for Tasmania, New Zealand, Patagonia and Antarctica.

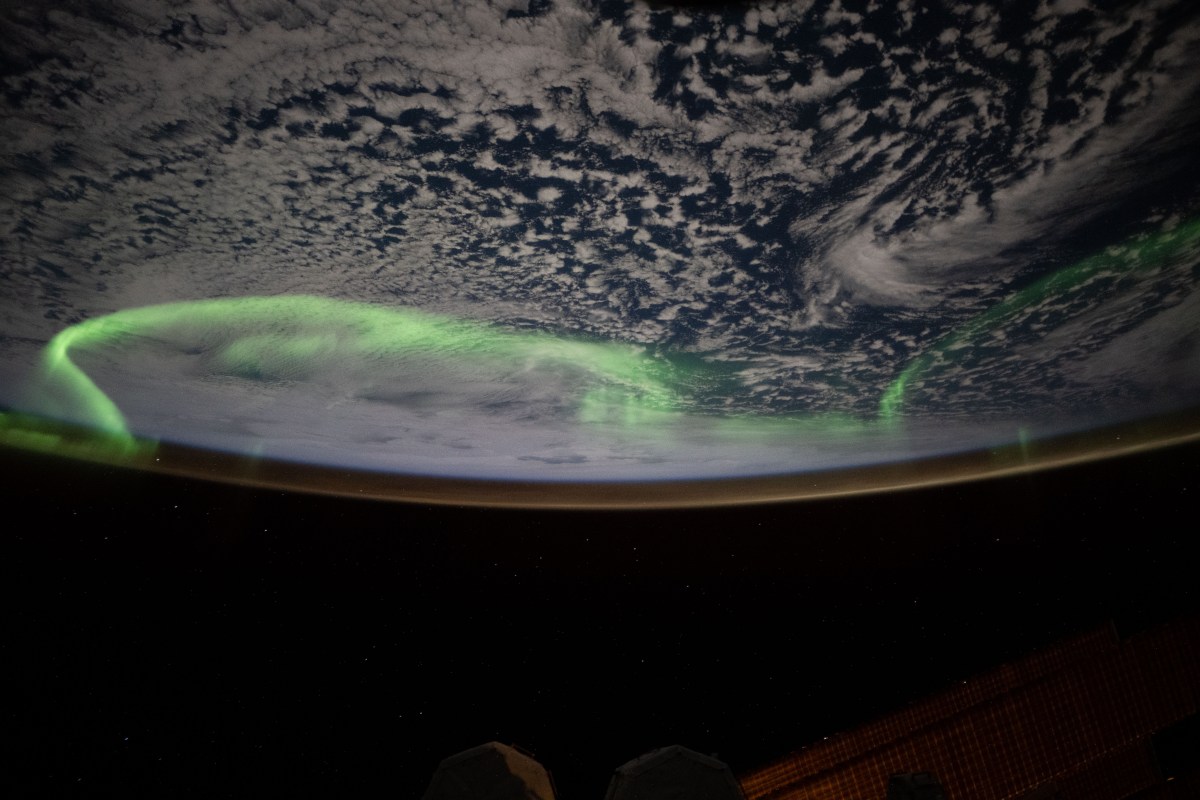
Archive photo: NASA / Nichole Ayers · ISS / 2025
—Latest observed Kp
Checking source…
—Maximum forecast Kp · next 24 hours
—OVATION map valid time
See source status and valid time below.
Loading NOAA data…

Southern Lights now — live Aurora Australis map

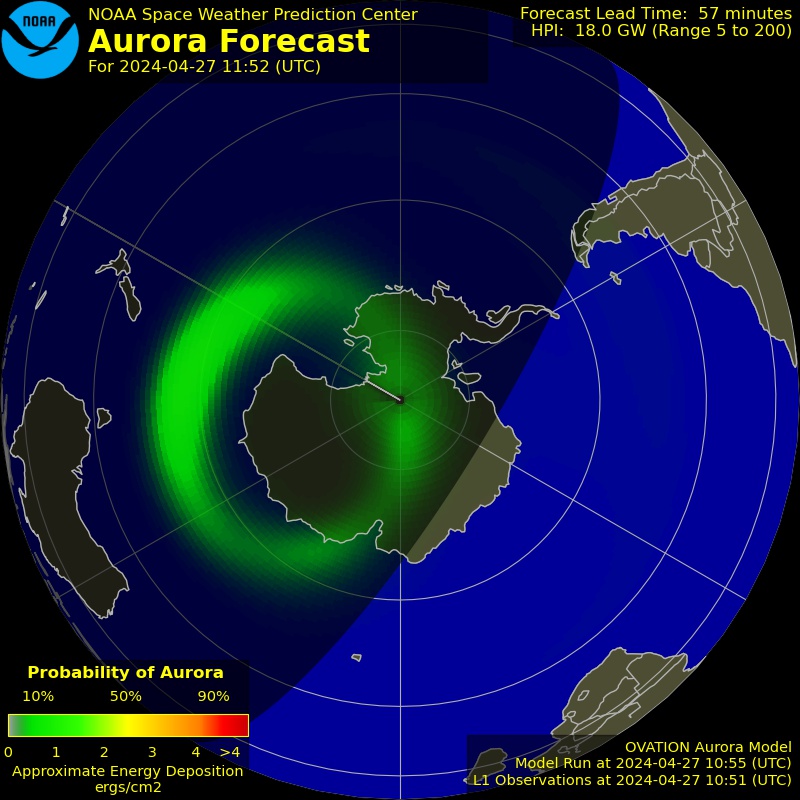
The coloured band shows where NOAA OVATION models auroral activity around the South Pole. This polar view refreshes with the interactive map: green indicates a lower model signal, progressing through cyan and violet to magenta for stronger signals.

This is a short-term southern lights forecast, usually 30–90 minutes ahead, rather than a camera or confirmed sightings. Always check the valid time below the map. Rings mark geographic latitudes, with the geographic South Pole at the centre.

For your location, choose a destination on the map below and compare activity with darkness and cloud cover.

Explore your location on the map ↓

NOAA SWPC · OVATION

Southern lights map now

NOAA OVATION · usually a 30–90 minute forecast

This is a model forecast, not a map of confirmed sightings. Cloud, light and your horizon affect what you can see.

Choose a destination or any point between 30° and 85° S.

Loading official data…

⌁ Aurora destinationsModel signal1100· Zero cell: no colour overlayEnhanced display contrast. Colours show model intensity, not observed aurora colours.

Updates every 5 minutes while the page is visible. Southern hemisphere, geographic map displayed to 85° S. NOAA OVATION · Official polar map

Hobart

—OVATION
—Sky illumination now · calculated

Detailed weather forecast →

Cloud and weather for aurora watching

Darkness is calculated from solar altitude; it excludes light pollution, moonlight and terrain obstructions. These factors are not combined into an unvalidated sighting percentage.

Aurora outlook · 3-day Kp forecast

Planetary geomagnetic activity in three-hour intervals. Table times are UTC.

Loading…

UTCKpTypeNOAA G

NOAA · 3-day forecast · Kp is not a local sighting probability.

Where to see the southern lights

Tasmania, New Zealand, Tierra del Fuego and southern Patagonia: compare activity with local conditions and find a dark spot with an open southern horizon. South Africa is included for rare strong events. Antarctica is a monitoring region, not an ordinary travel destination.

Northern Lights and Southern Lights: viewing guide

Northern Lights forecast: planning your next clear night

Northern Lights and Aurora Borealis refer to the same northern aurora. A high Kp value alone does not make a viewing plan: check local cloud, hours of darkness and an open horizon away from artificial light. Strong activity cannot overcome an overcast sky.

Compare weather forecasts for Tromsø and Alta in Norway, Reykjavík in Iceland, Abisko in Sweden or Inari in Finland. For Alaska and Canada, start with Fairbanks and Yellowknife. Destination links open our detailed weather forecasts so you can compare conditions before choosing a viewing spot.

NOAA · Aurora viewing conditions

What about the Southern Lights — Aurora Australis?

The southern aurora forms a corresponding band around the southern geomagnetic pole. Antarctica and Tasmania are notable viewing regions. In South Africa, sightings are very rare: SANSA documented them during the extreme geomagnetic storm of May 2024.

The two sections use data from their respective hemispheres. Use the southern map for Patagonia, Australia and New Zealand. Kp is a shared planetary index; local darkness and weather vary by location.

NOAA · Southern Hemisphere · Australian Antarctic Program · SANSA

How do I read the map?

NOAA OVATION estimates auroral location and intensity, usually 30–90 minutes ahead. Use the displayed valid time. If solar-wind inputs are unavailable, the model may use Kp with no forecast lead time.

Sources: NOAA SWPC

What does Kp tell me?

Kp describes planetary geomagnetic activity in three-hour intervals. It is not a local sighting probability. Observations, estimates and predictions are shown separately.

Sources: NOAA SWPC · NOAA SWPC

Clouds and darkness

Cloud and artificial light can obscure aurora. Look for clear skies, low light pollution and an unobstructed horizon towards the pole. Cloud forecasts remain estimates: check the actual sky too.

Sources: UK Met Office · NOAA SWPC

Can I see it from Greece?

Aurora on the map does not guarantee a sighting from Greece or any particular location. Kp offers broad context and its relationship with auroral extent is approximate. Check timing, cloud, darkness and your horizon.

Sources: NOAA SWPC · UK Met Office

When should I travel to see the northern lights?

Choose a season with enough darkness and allow several nights. Arctic summer daylight makes viewing difficult. Geomagnetic activity often increases around the equinoxes, but no month or destination guarantees a display. A three-day outlook cannot predict the aurora for a trip months away.

Sources: NOAA SWPC · NOAA SWPC

How do I plan an aurora watch tonight?

Choose a place, check the OVATION valid time, and compare Kp with local darkness and cloud forecasts. Use a safe location away from bright lights with an open horizon towards the relevant pole. Dress for the cold and check roads and wind before travelling. A camera may record faint colours that are harder to see by eye.

Sources: NOAA SWPC · UK Met Office
Sources and updates

Live means automatic refresh of available data. Observation time, forecast valid time and retrieval time are different. Older or unavailable feeds are labelled, and stale point signals are withheld.

Methodology and sources reviewed: 11 October 2026.

All Xionia weather tools · Weather in polar regions